 " alt="" loading="lazy">
The only two things a seller really needs to understand about this market is the average number of showings per listing each week and how many showings it takes to get a contract. The combination of these two will reinforce the importance of condition, price and patience in this market, this time of year.
Ok, that’s not totally true, sellers should understand a few other things:
- Buyer activity is unseasonably strong due to pent up demand and declining interest rates.
- There are 10,000 homes on the market and days on market are increasing each week. Likely before year-end DOM will surpass 60, if not 75 days.
- That we are almost 3 months into the negative price curve season and that prices will continue to drop through the end of the year.
- Buyers are asking for concessions to be paid by the seller, averaging $6,500 per contract.
- Sellers will continue to pay buyer agent commissions as negotiated per contract.
- 45% of properties are experiencing a price reduction and climbing.
- 66% of properties are selling for less than the asking price and climbing.
- That this is a normal real estate market and excellence, professionalism, patience, strategy and partnership is important.
But what will really drive sellers making great decisions relative to their goals is understanding the relationship between increased inventory, buyer showings and buyer patience.
While buyer activity is very strong for this time of year at 22,800 showings last week, with inventory over 10,000 homes on the market, the average property is only receiving 2.2 showings per week as of last week.
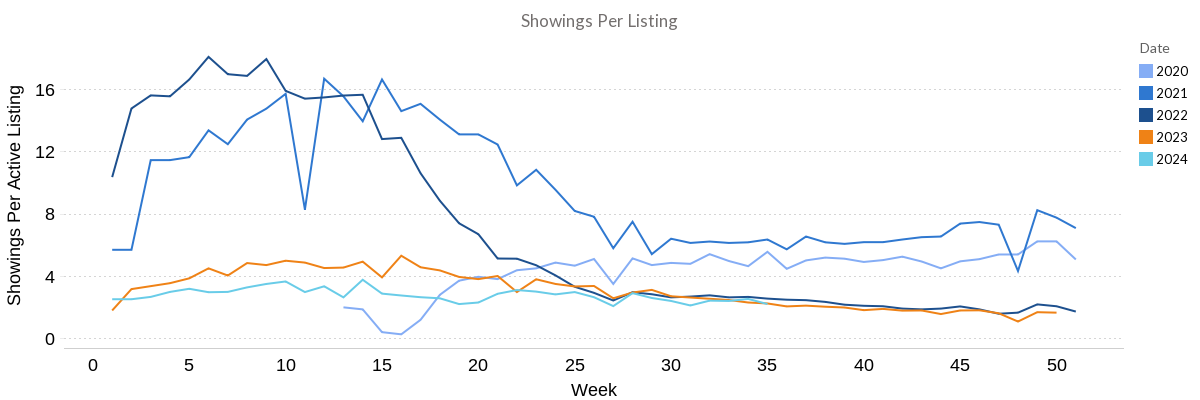
This is a frustrating pace for sellers who during the pandemic got used to as many as 18 showings on average. And we all remember the stories of 40-50 showings in the first weekend on certain properties. Now, we are at 2.2.
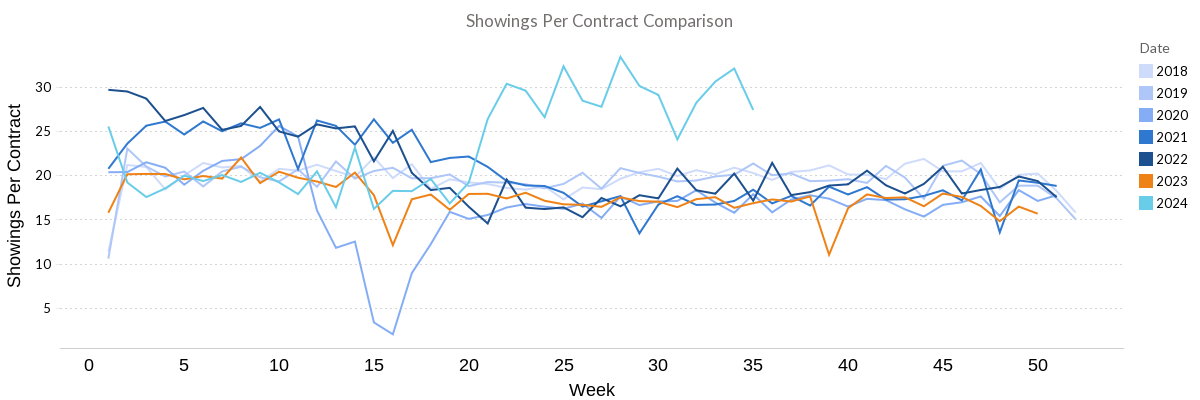
But what is more telling is the shift in buyer behavior. Buyers are simply viewing more homes before writing offers and started doing so in early May of this year, just as interest rates began their decline.
Days on market is a lag indicator, meaning it measures what happened in the past. The chart above coupled with higher inventory and seasonal history simply predicts that days on market will get long and prices will decline.
If you simply take 2.2 showings per week divided into 30 showings to get a contract, that’s 13.6 weeks, or 95 days on market.
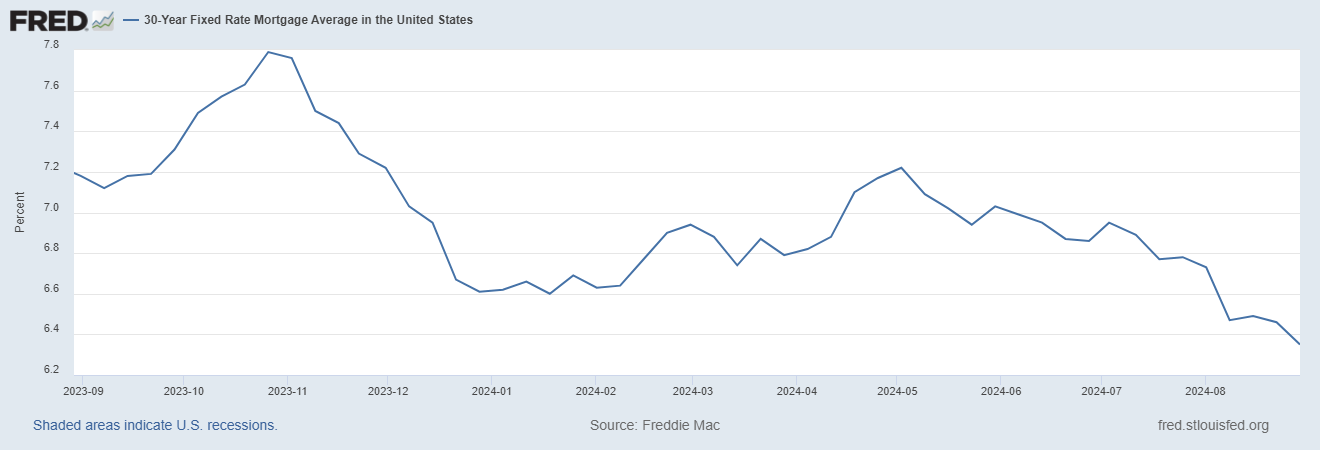
Now, that could be countered by a massive decline of interest rates, which are down by a full percentage point from just 4 months ago and the lowest in well over a year.
If this trend of rate drop continues, it’s possible that pent up buyer demand hits the market in a way we haven’t seen since the early days of the pandemic and demand skyrockets.
But that is not strategy, that is hope. Strategy says, sellers should plan on days on market getting longer and prices declining. Strategy says, sellers need to prepare their homes extremely well and understand the concept of a seasonal negative price curve (If their neighbor’s comparable home just sold, their home will likely be sold at a slightly lower price than their neighbor).
All of this is an incredible opportunity for buyers, possibly the most asymmetrical buying opportunity we’ve seen since 2020. If buyers believe the narrative that rates will continue to decline, that wealthier people are moving to Colorado driving prices up, that prices will likely increase next spring and rates will drop even further and that the market volume will pick up substantially next spring, buyers should look at buying over the next couple months to capitalize on what is likely to be the lowest prices this market will see again.

