 " alt="" loading="lazy">
Once again, buyers are active but cautious, prices are showing signs of stability, but larger homes are selling, interest rates declined yet again and inventory jumped about 5%.
Prices
The Denver median single family home price remains strong and mostly stable since early May of this year, ending last week at $660,000. Likely, increased buyer activity driven by declining interest rates has helped with price stability.
If interest rates continue to decline, stronger than typical seasonal buyer demand may keep home prices elevated through year-end. Still expect a negative price curve, but maybe just not as significant as we’ve seen in years past.
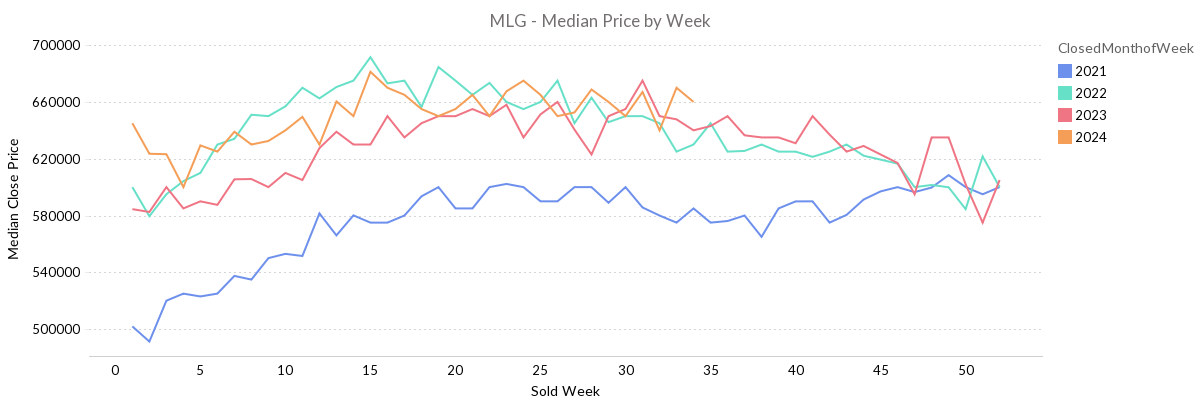
While there have been wild fluctuations in home prices since early 2021, it’s interesting to note that each of the last 3 years have ended with a median home price for a single family home, within 1% of $600,000. Meaning, real estate values have largely not appreciated, or depreciated over the last two years and instead it has been timing the market where homeowners either made or lost money.
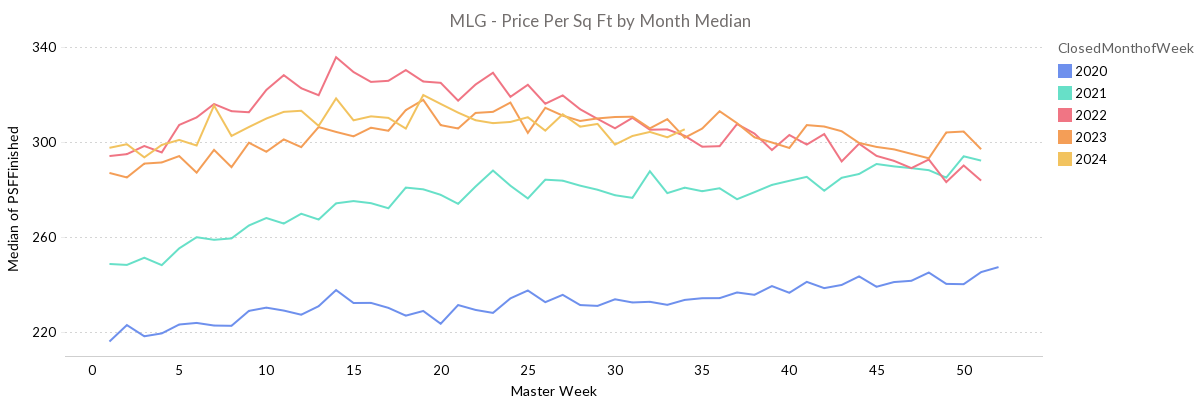
But larger and thereby more expensive homes are selling this year, with price per square foot virtually identical between this year and previous two years. What we are experiencing as modest price appreciation this year is actually a shift in the size of homes sold.
Last week as an example, the square footage of the median sold home was 1,711 square feet, where the median in 2023 was 1,586 square feet. At $300 per square foot, that’s a $37,500 price difference.
Active and Cautious Buyers
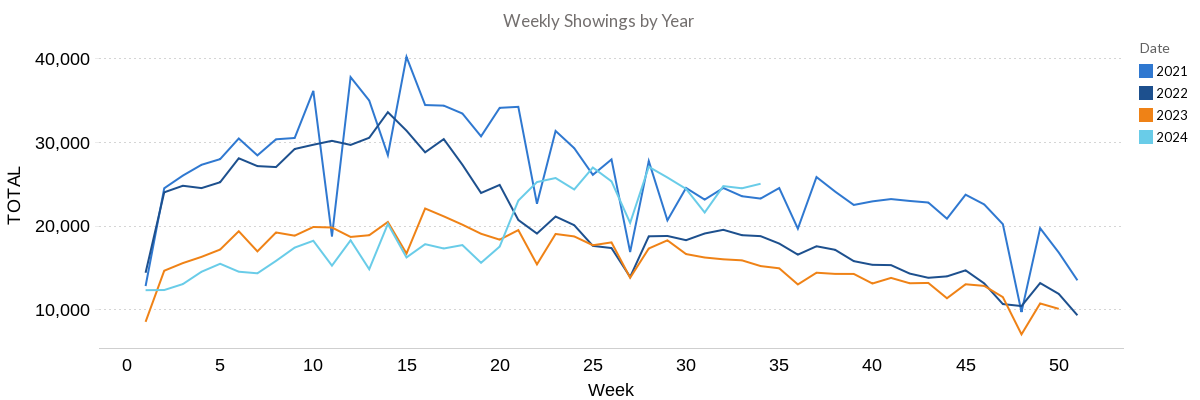
Home showings remain extremely elevated for this time of year with exactly 25,000 showings last week, 10,000 more than one year ago. Anticipate that if interest rates continue to slide, relative showing activity will remain elevated through year end and be the catalyst for a very busy Spring 2025 selling season.
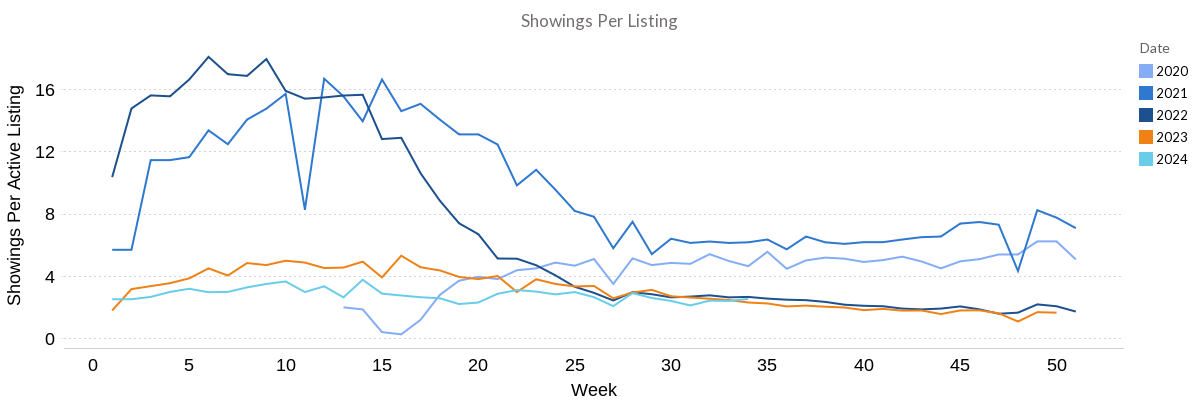
But again, buyers remain cautious which makes the market feel excruciatingly slow for sellers. While total showings are seasonally very high, with the increase of inventory over the last couple years, showings per listing each week remain extremely low, ending last week at 2.53 showings per property.
To put it in perspective however, the busiest years on record of 2020 and 2021 only had 4.63 and 6.16 showings per week respectively this time of year.
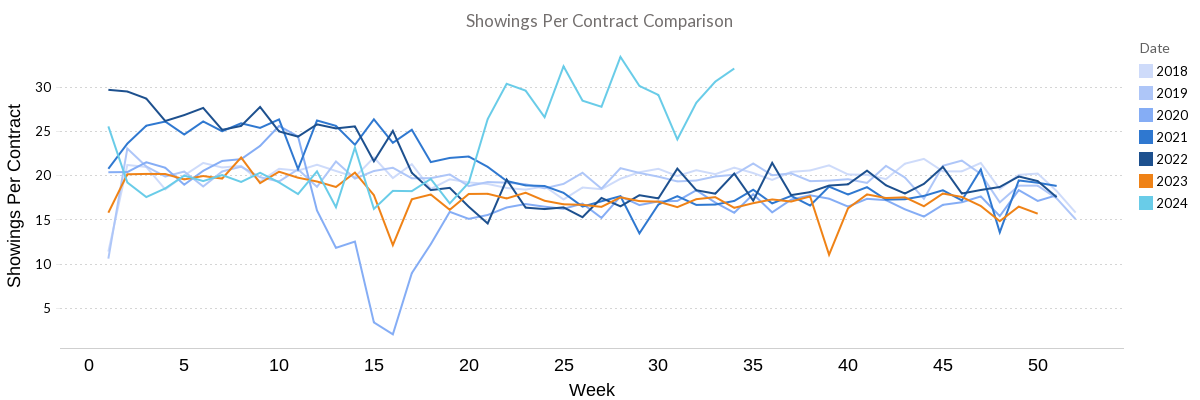
But what really tells the tale of seller experience is the number of showings it is taking on average to get a contract. And these are truly historic numbers at more than 50% higher than our market averages.
It typically takes 16 to 19 showings before a home goes under contract and as of last week and largely for the last 4 months it has taken closer to 30 home showings, before a home goes under contract. It cannot be overstated how strong buyer desire is right now. But this chart is undeniably demonstrating buyer caution.
Inventory
Somewhat surprising, inventory jumped by about 500 homes last week, ending at 10,386 properties available for sale, compared to 6,595 one year ago.
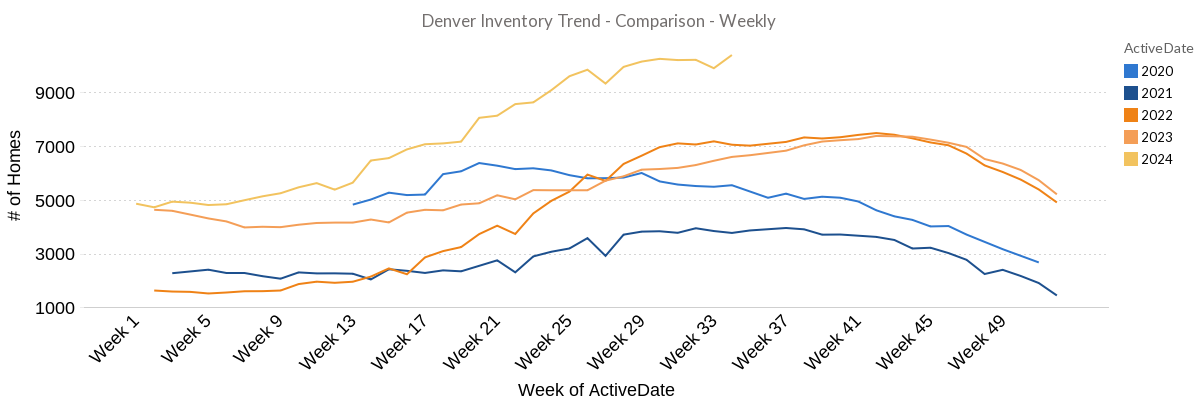
Inventory may decline a bit between now and labor day, but expect inventory to rise as we reach early fall and peak around the end of September.
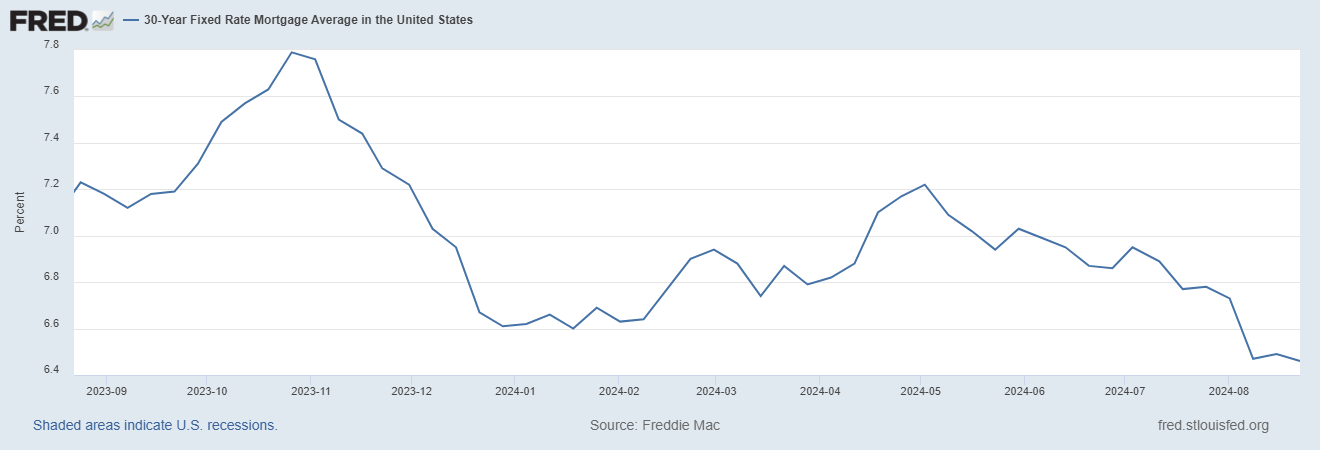
Interest Rates
All economic signs and trading principles of mortgage backed securities point to a continued decline of interest rates. As of Friday, August 23rd, a highly qualified buyer could get 5.875% on a 30 year fixed conventional loan and 5.25% on a 30 year FHA or VA loan.
If the economic signs and mortgage backed securities trades play out as expected, we will soon see conventional 30 year loans in the low 5’s and government loans in the mid 4’s.
This will spur not only a significant amount of buyer action, but will inspire sellers who have wanted to move but have been too in love with their 3.5% rate on their mortgage, to sell their home.
Expect a fairly significant increase in market volume over the next 12 months, as much as 20% higher than what we’ve seen over the last 2 years.
