 " alt="" loading="lazy">
Lots of activity! Buyers continue to look at lots of homes and are writing a few more contracts. Conversely, more properties are being withdrawn and expired than the average for this time of year causing inventory to experience a slight decline.
Lots of movement in price reductions, increase in concessions, offers below asking, increase in days on market and a huge number of showings per property contract. And with a significant increase in the average square foot of sold properties last week, the average price per square foot dropped to its lowest level in 18 months.
But with interest rates more attractive than they have been in over a year, the overall market narrative is stable and healthy. It may not feel that way to much of our industry as more than 90% of agents have been in the business for less than 10 years. In the last 10 years, rates have been low, inventory low and buyer activity strong with appreciating home values.
Get used to longer days on market, unstable prices and clients who demand more excellence and value than ever before. And, let’s celebrate that. It is exactly this consumer demand of value that will cause the Rise of the Professional.
Those that adapt will deliver better service, receive more referrals and make more money and have more freedom than ever before. Those that don’t adapt, should just get out now.
Price Reductions and Sold Over/Under Asking
As fall approaches, sellers are demonstrating anxiousness to get their home sold through an accelerating percentage of homes experiencing a price reduction. In the next few weeks, expect the red and yellow lines to cross the earliest time in the year since 2010.
As of last week, 48.2% of active home sellers have reduced the price of their for sale home. For your sellers who need to sell, remind them of the market conditions. That home’s values are seasonally on the decline, buyers are patient, inventory is up and if they need to sell, they likely need to get aggressive with price.
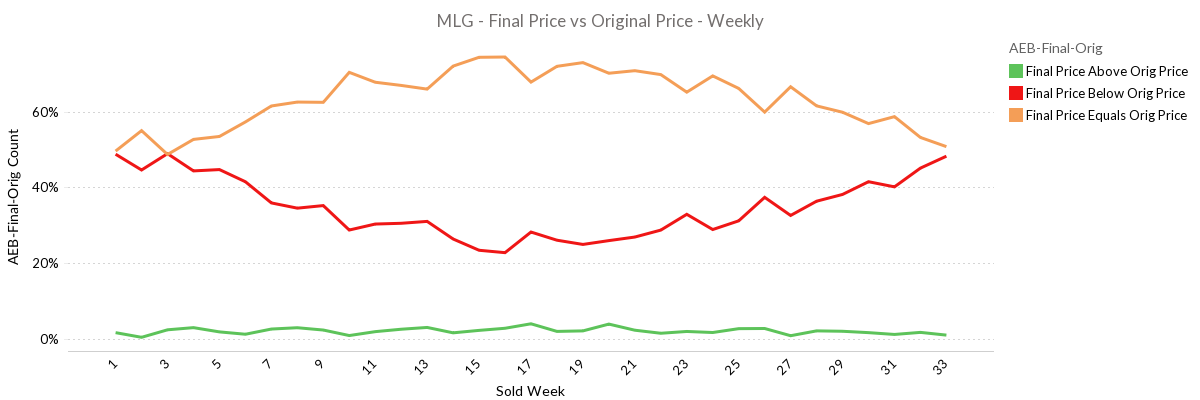
And the percentage of properties selling below the asking price continues its climb, ending last week with 67.9% of properties selling below the asking price and 16.3% selling for above.
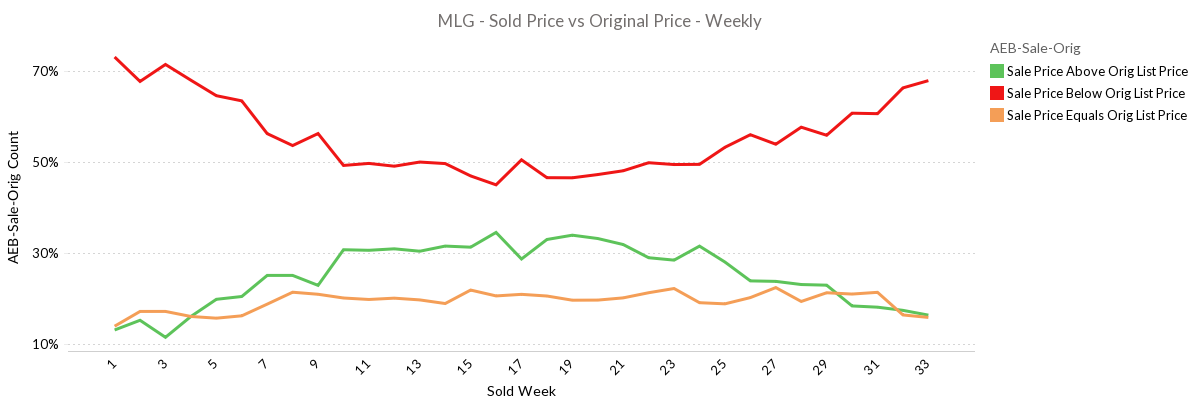
The last time we saw 67% of properties selling under the asking price in August, was 2012.
Days On Market
Inventory remains high and buyers are active, but patient. The combination of these two means days on market climbs. Assuming history repeats, and it will, days on market will continue to climb through year end. The last two years we topped out at about 57 days on market. At our current pace, we will far surpass that.
Last week, days on market hit 44.86 days on average, the highest this time of year in over a decade. 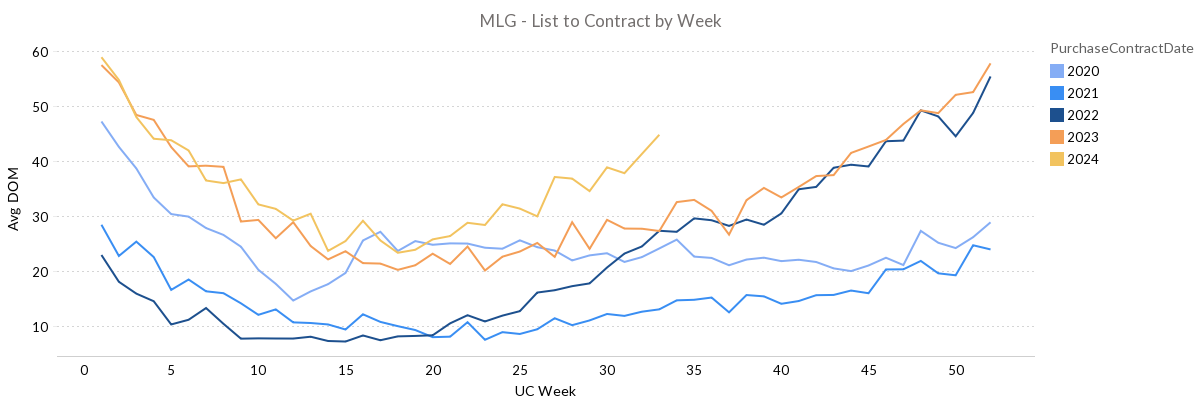
Showings
Buyer activity remains very strong and other than 2020, record breaking. We experienced 24,458 showings last week compared to just 15,849 for the same week last year.
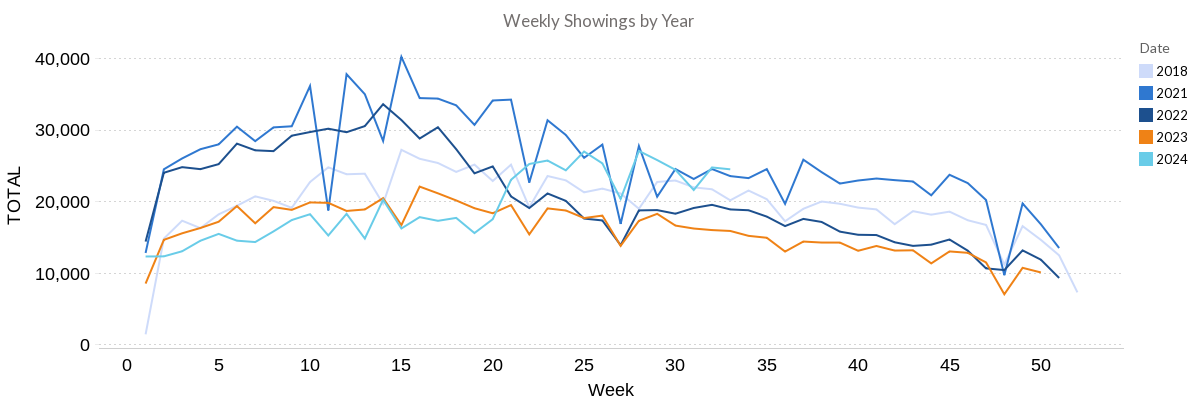
However, as the narrative has been for over three months now, buyers are viewing lots of homes, but slow to write contracts. For decades, it would take approximately 18-20 showings to get a contract for the average property, with anomalies 2021-early 2022 with aggressive buyer activity.
We are now seeing the exact opposite of aggressive buyer activity and an even wilder anomaly. We are seeing strong but patient buyer activity and last week it was taking 30.61 showings on average to get a contract on a property.
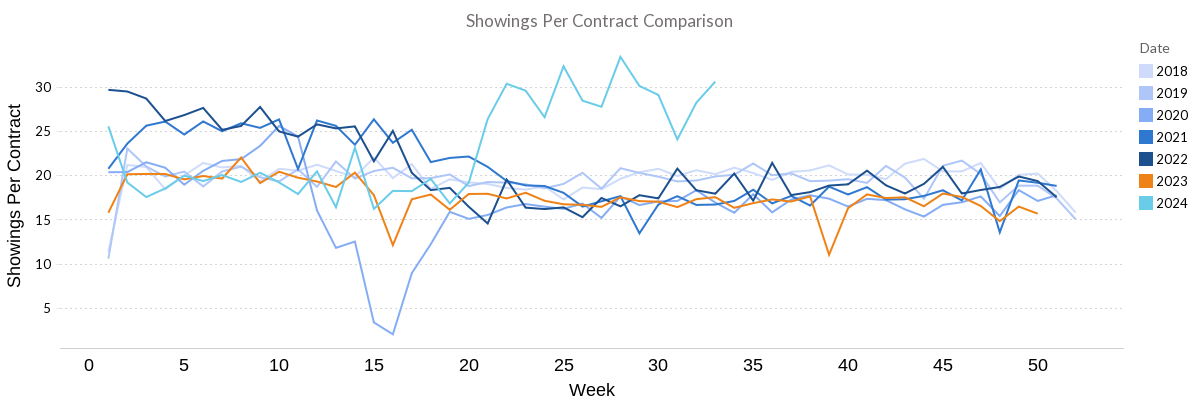
This is a profound leading indicator that days on market are climbing and climbing rapidly. The average property is only getting 2.4 showings per week. Divide the need for 30.61 showings for a contract by 2.4 showings per week and we are headed toward 12.75 weeks, or 90 days on market.
It remains to be seen if buyers will continue to be passive. If rates decline further, momentum may build around buyer decisiveness and days on market may level off for a period of time.
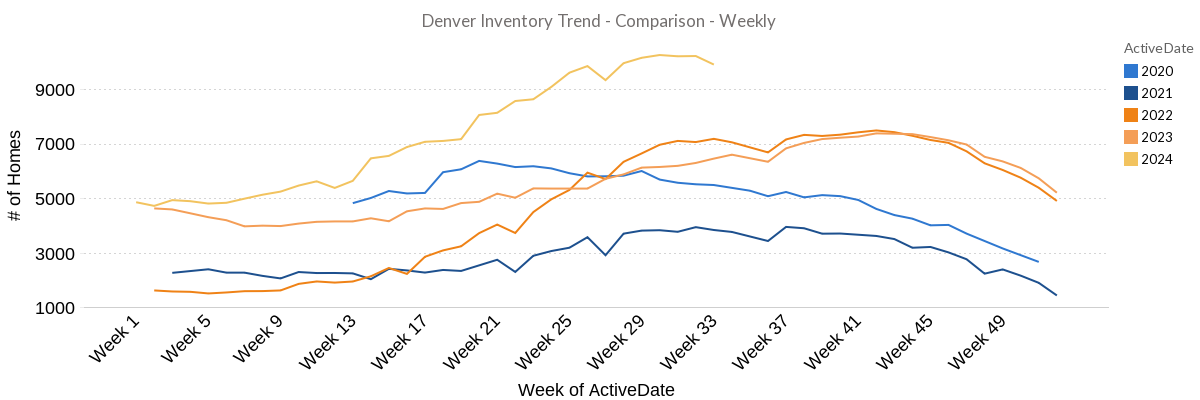
Inventory
Inventory dropped a bit last week, ending the week at 9,895 properties for sale. August often experiences a decline in new listing activity which coupled with a slight bump in under contract properties contributed to the slight decline. Adding to that however is activity of withdrawn and expired properties higher than usual at 205 and 239 properties respectively.
While 249 properties came back on the market last, 181 of these were properties that fell out of contract. Meaning, of the 444 expired or withdrawn properties, 376 of them did not come back to market.
These 376 properties represent despondent sellers who may just be calling it quits.
Conclusion
Not much has changed. With interest rates having come down and the expectation they will drop further, our narrative remains the same.
Buyers – Prices have come down and will continue to slide through the year-end. With interest rates almost guaranteed to decline over the next 9 months, the next 6 months is an incredible buying opportunity before the acceleration of prices into the 2025 spring selling market. Buyers can be aggressive on offer price, concessions and dictate most of the terms on contracts. Remember, sellers are getting 2.4 showings per week and days on market are rising. Buyers can afford to be patient and then demanding with offers.
Sellers – Days on market are rising and prices declining through the year-end. If a seller must sell now, they need to get aggressive on their price and ahead of the declining price curve. Sellers will be emotional and frustrated by this, but it’s just math. It’s like being mad that 2 plus 2 equals 4. You can be mad about it, but it’s just the reality. Sellers should expect offers below asking and very buyer favorable terms. Sellers should also know that prices will most likely climb next spring. If they cannot sell at today’s prices, next spring will likely be more favorable.
